
We all know what a line chart is, but besides the basics, there are also a couple of recognized shapes that convey a certain behavior and that are used as a shortcut. I am talking about thinks like “Linear”, Exponential”, the “Hockey Stick” and even some “fishy” ones.
Here we go:
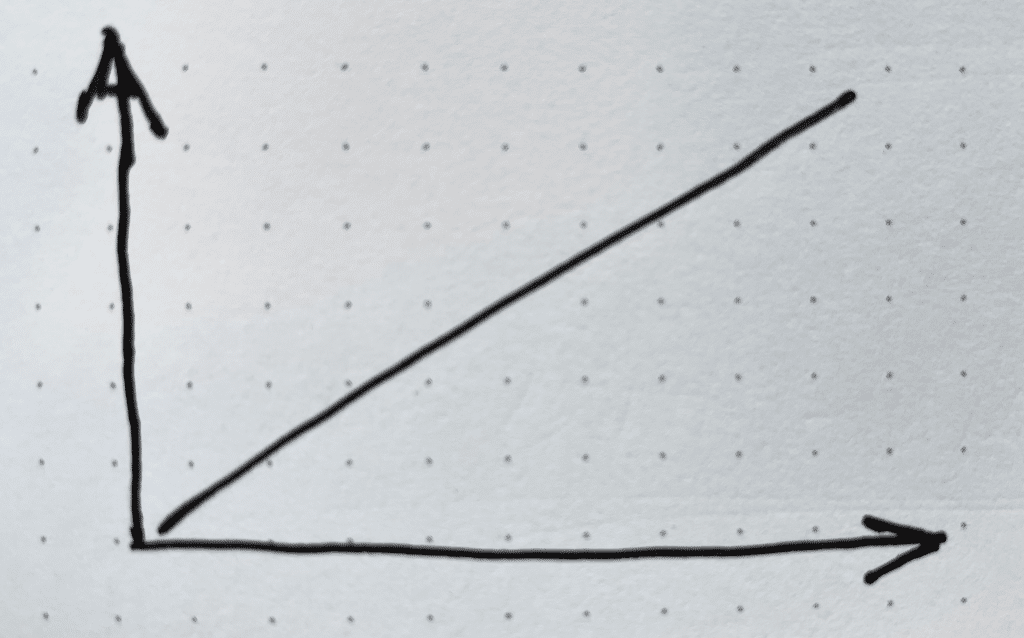
Linear
The simplest and the most common. Either descending, ascending. This is were the “up and to the right” very desirable situation comes in.
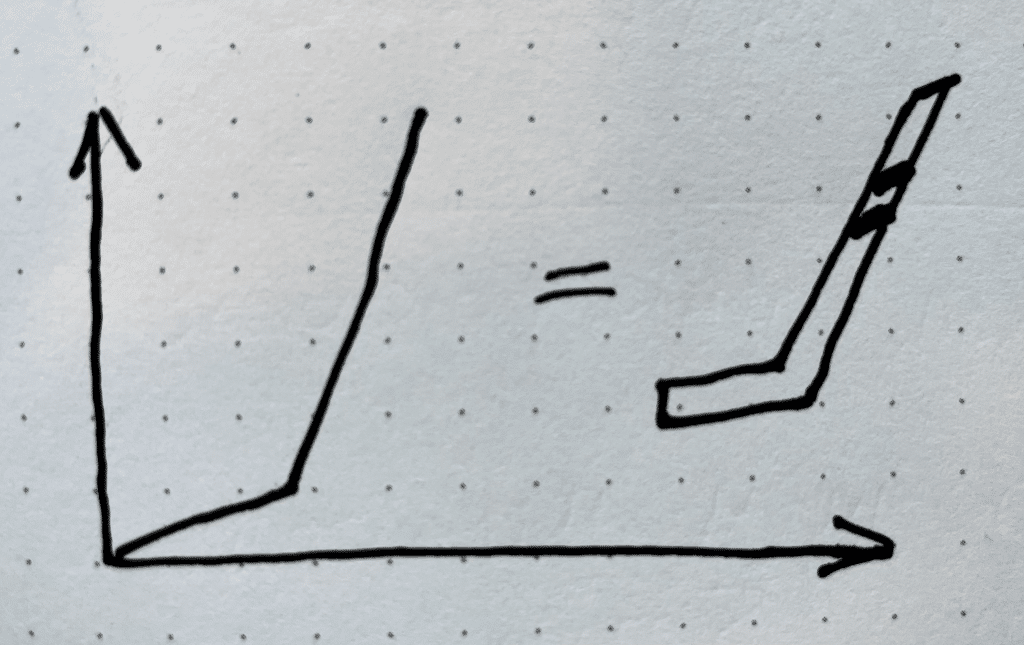
The “Hockey Stick”
This one is particularly popular on startup pitch decks. It is a special case of the prior one, where something magic happens at some point during the life of a venture and growth explodes. This can be Product-Market fit, adoption, entry to a specific retailer, etc. Some people make it, most don’t.
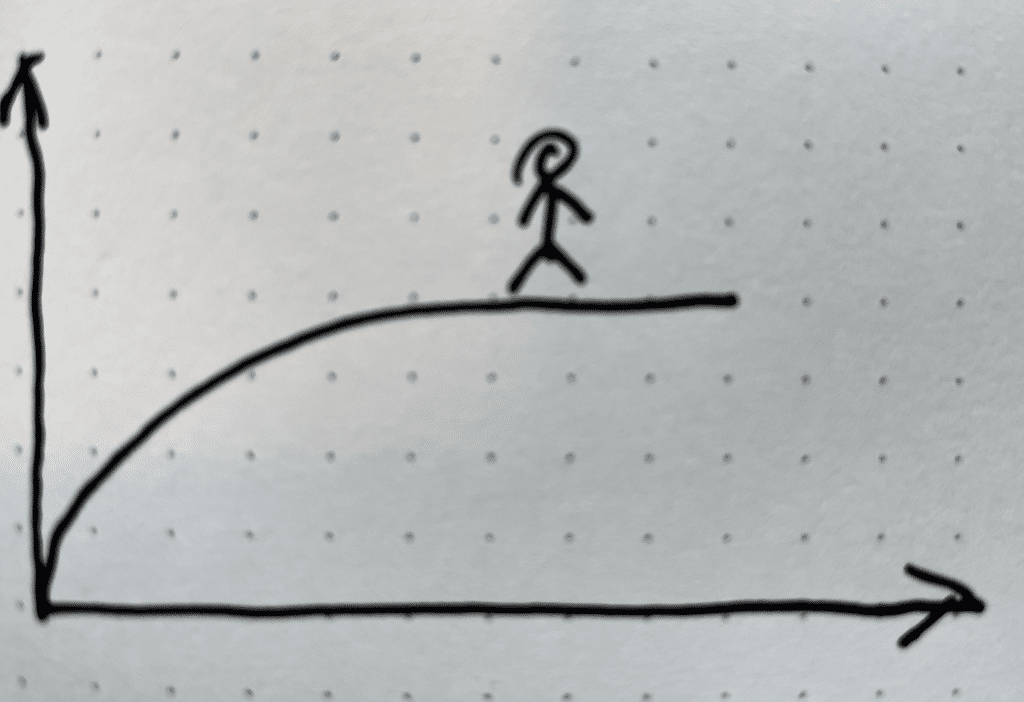
The “Plateau”
Named after the geographic feature, where you can stand nicely on top of a flat area, it happens mostly when businesses have reached some kind of limitation, either in production volume, or market saturation.
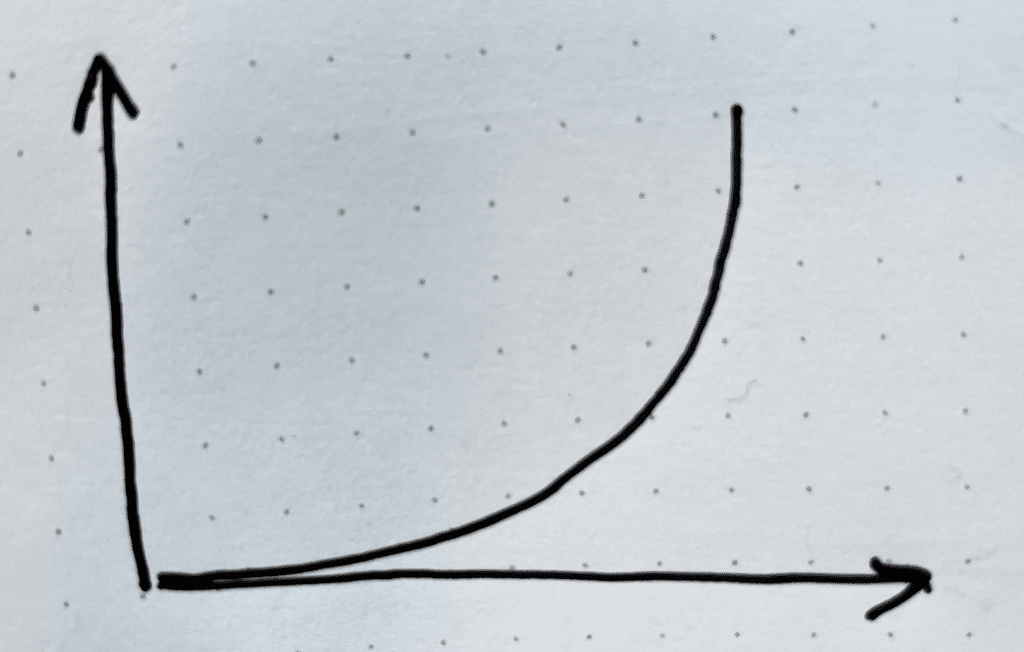
Exponential
A better projection than the Hockey Stick, but still super optimistic and very difficult to wrap our head around. Our brains are not trained to think exponentially. Here is an example: Let’s say we some algae on a lake and the area that the algae covers from the surface of a lake doubles every day. So day one it covers one sqft, day two covers two square feet, day three four sqft, and so on. If it took the algae a month to cover one half of the lake, how long it will take to cover the lake?
Guessed? Answer at the end.
Some processes, businesses, and technologies behave exponentially, especially those that have a Network Effect.
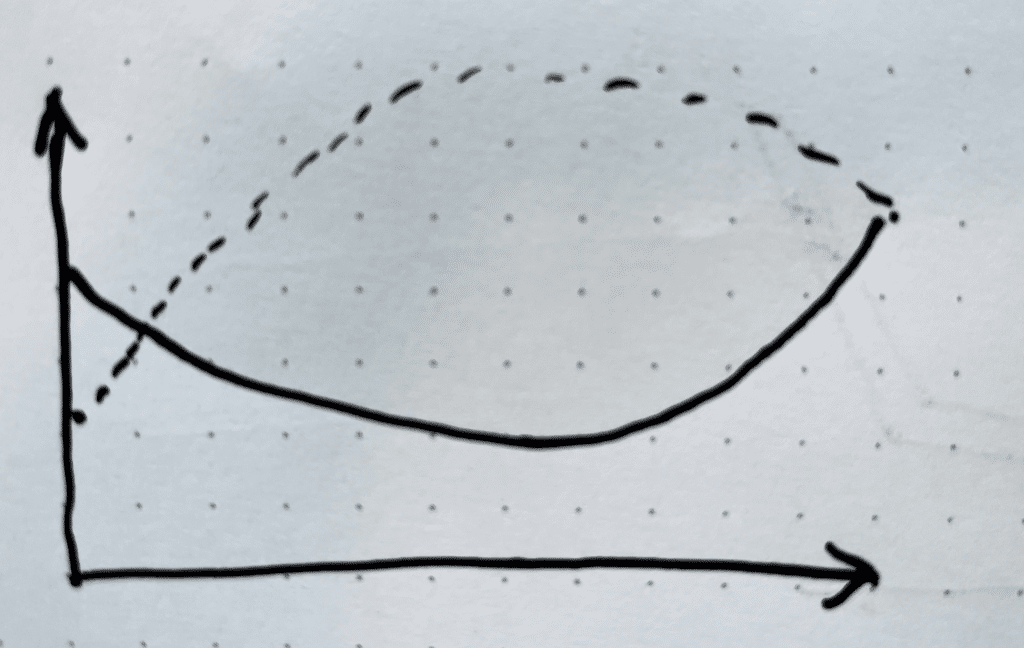
The “Fish Chart”
This is an important chart. There are certain situations, especially when we are phasing out one thing for another, when this chart happens. I’ll say that most management don’t like fish. But more on that later.
Answer: If one half is covered, and it doubles every day, the next day will be covered completely, so the answer is One Day. This illustrates how hard is for our mind to think exponentially.